Multi Dimensional Viewer
Multi-Dimensional Viewer (MDV) is tool for analyzing, annotating and sharing multi-dimensional data
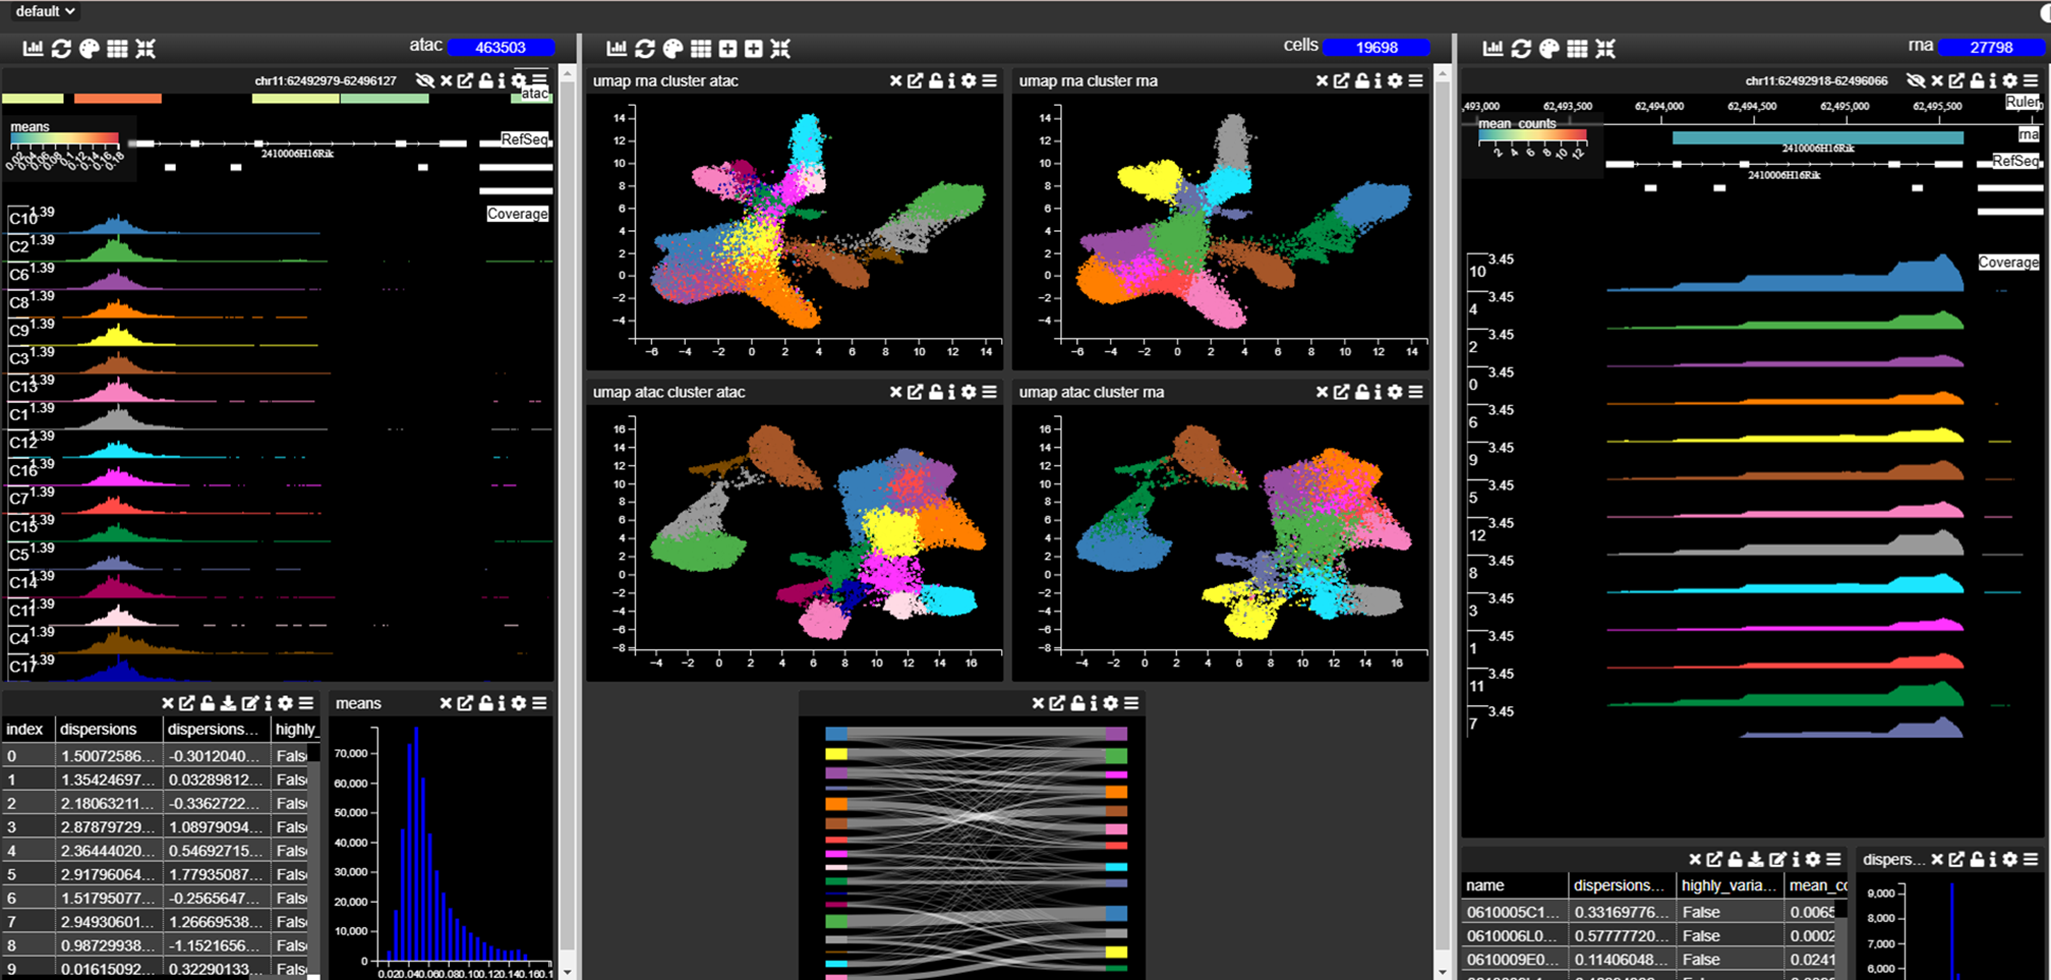
Multiome Analysis
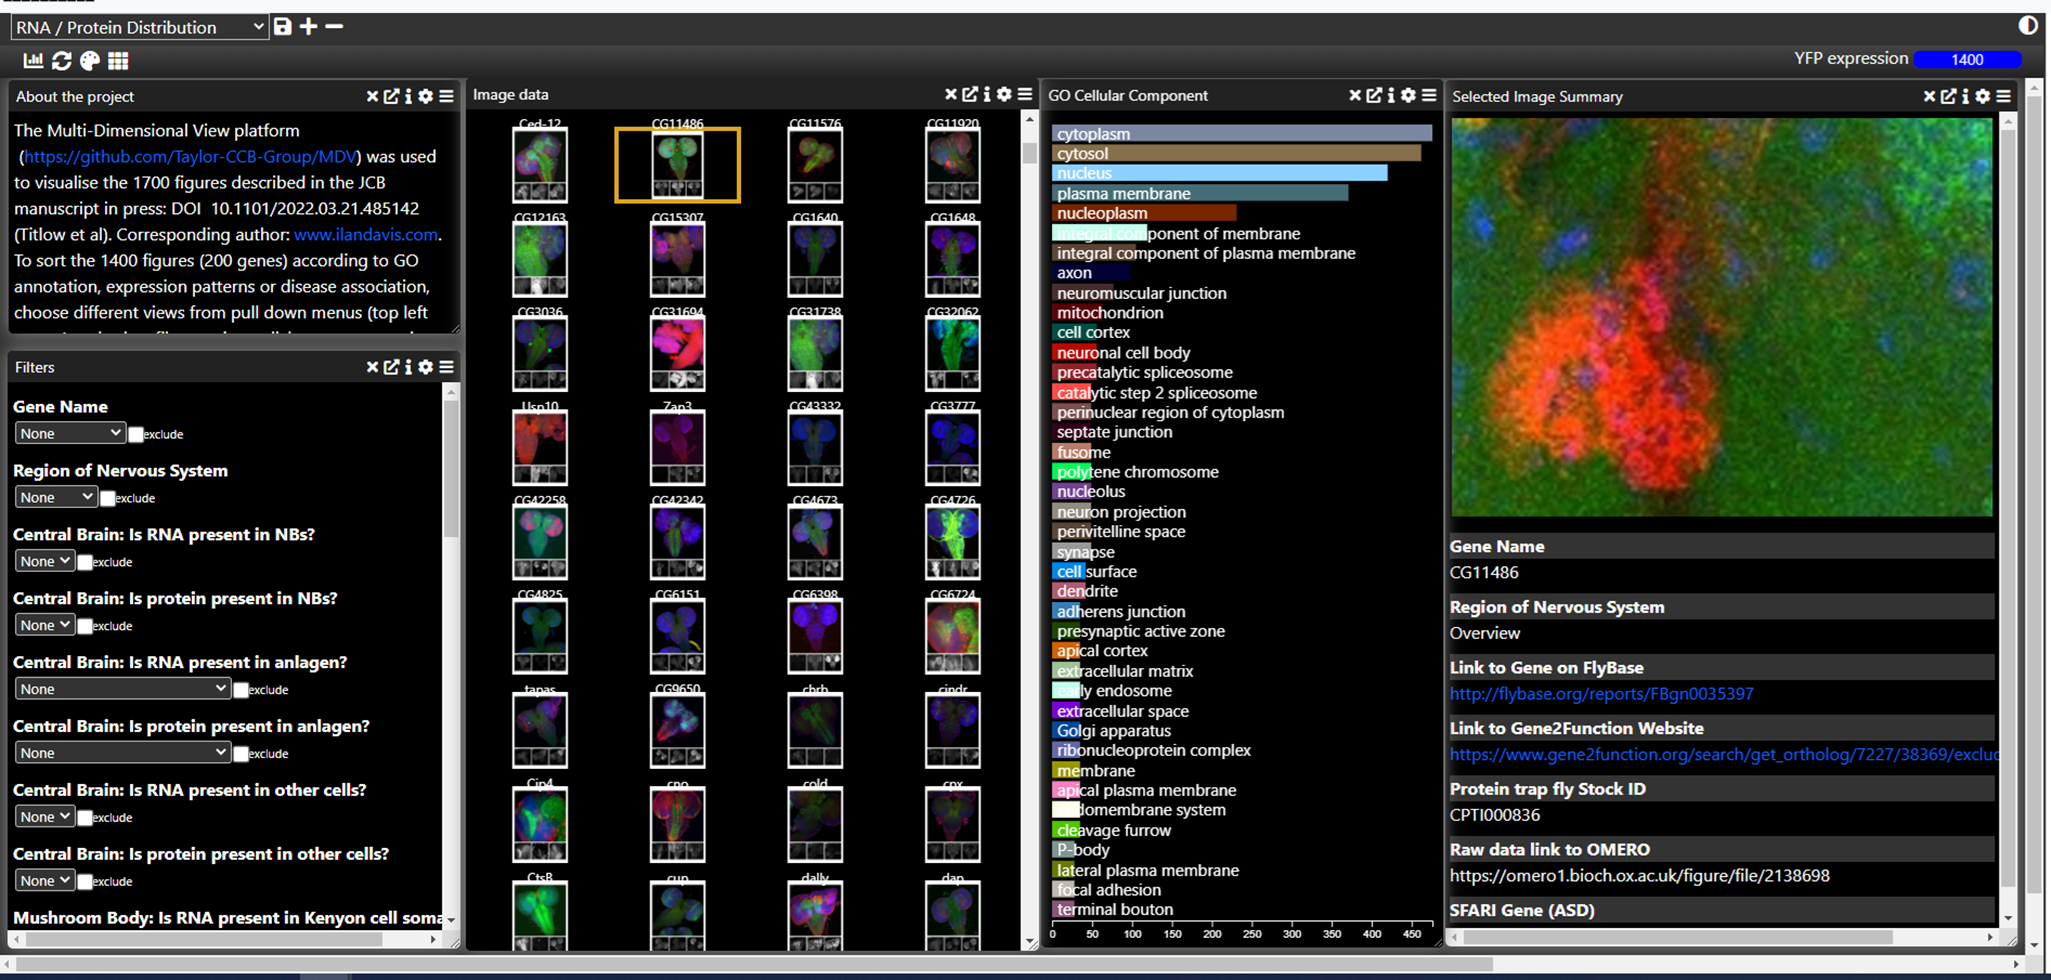
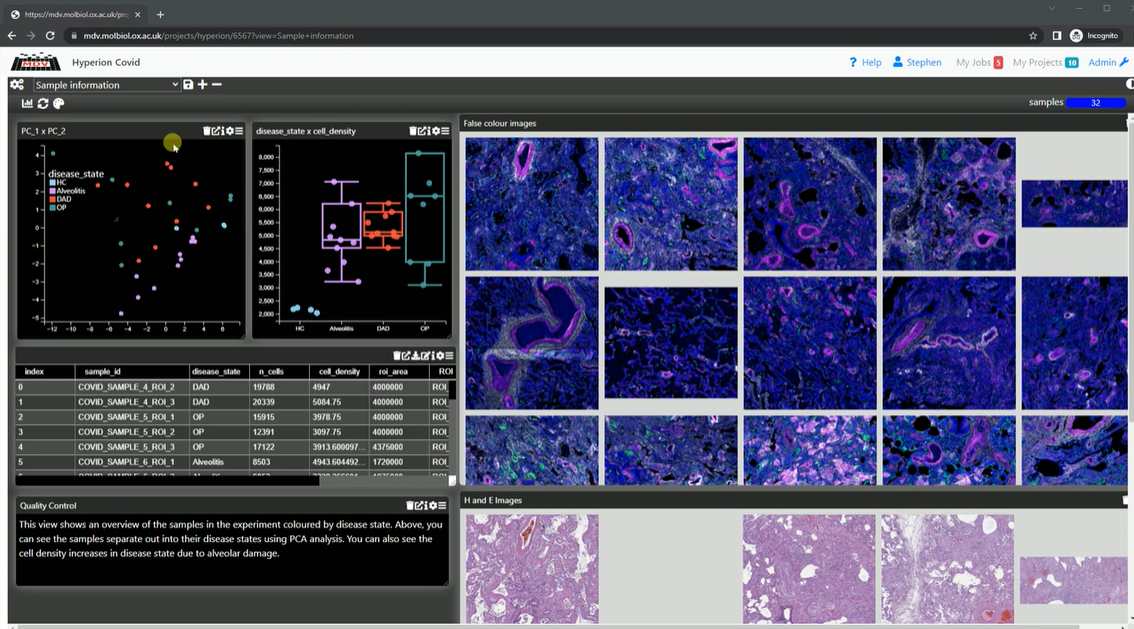
General Image Management
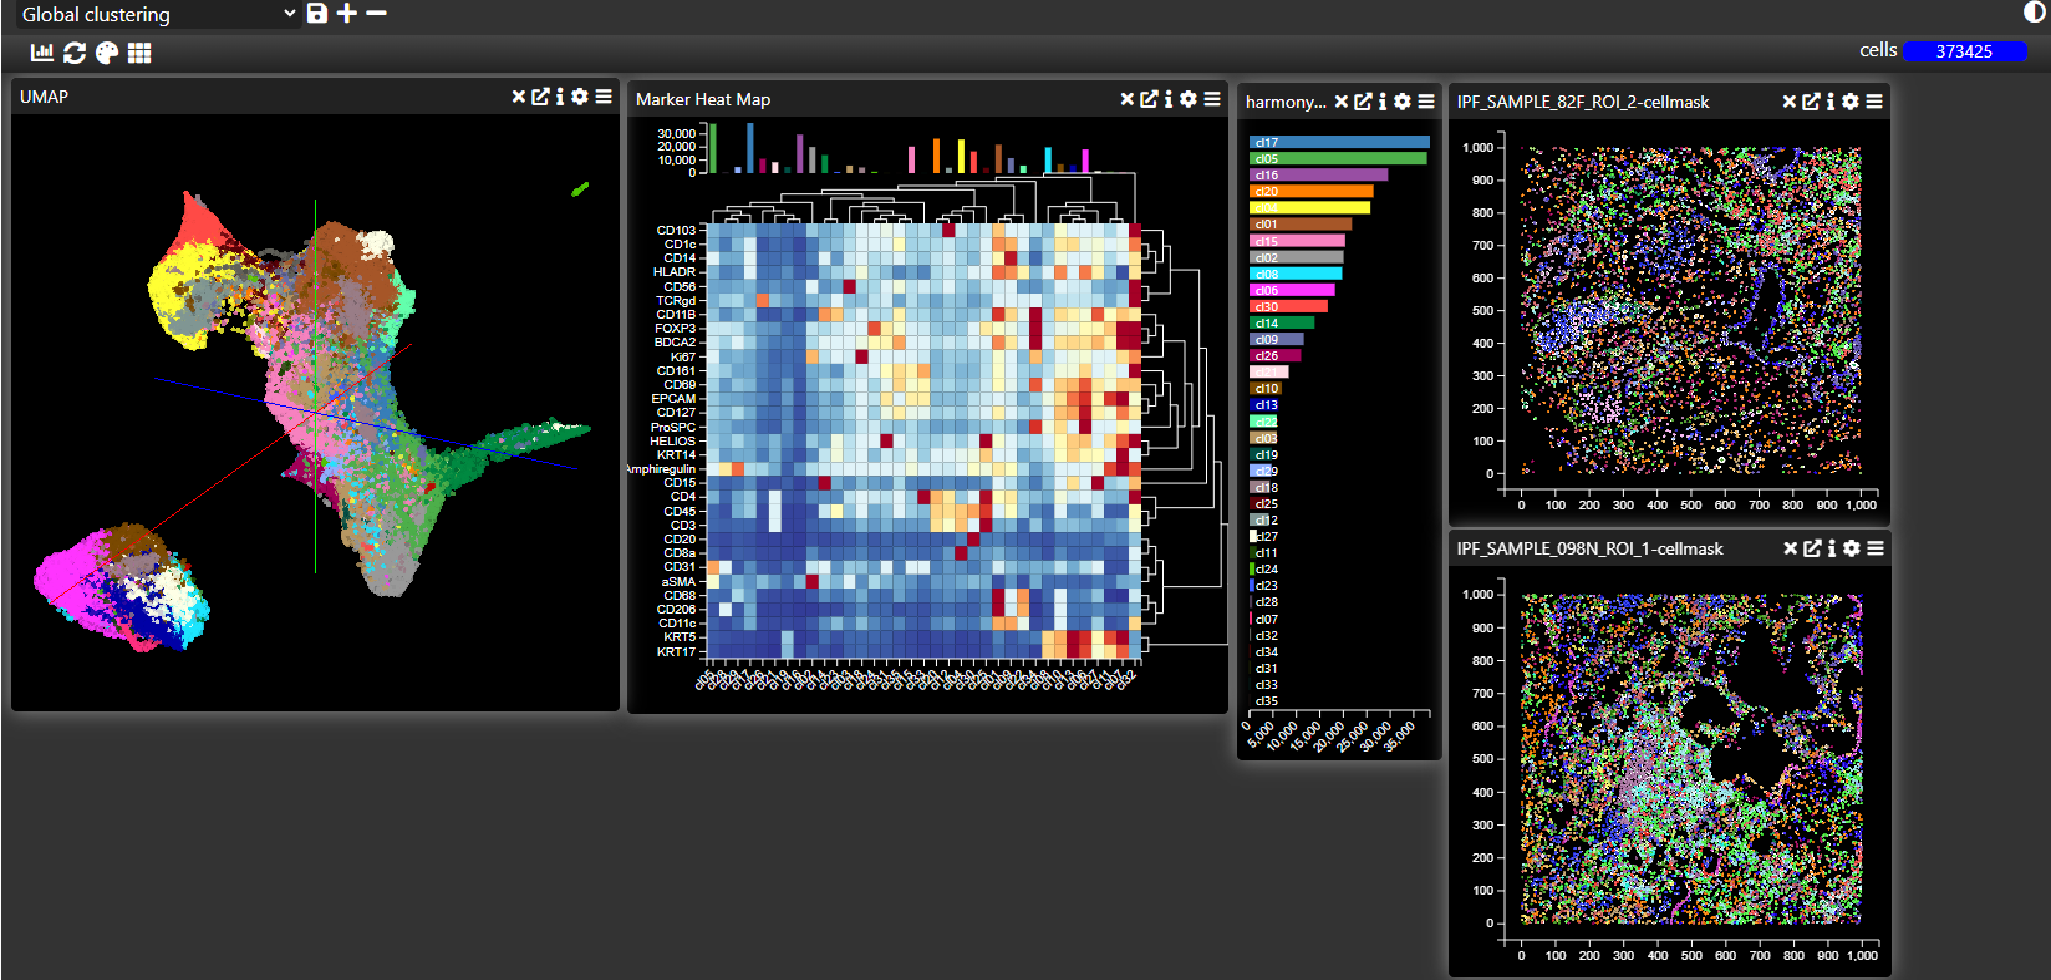
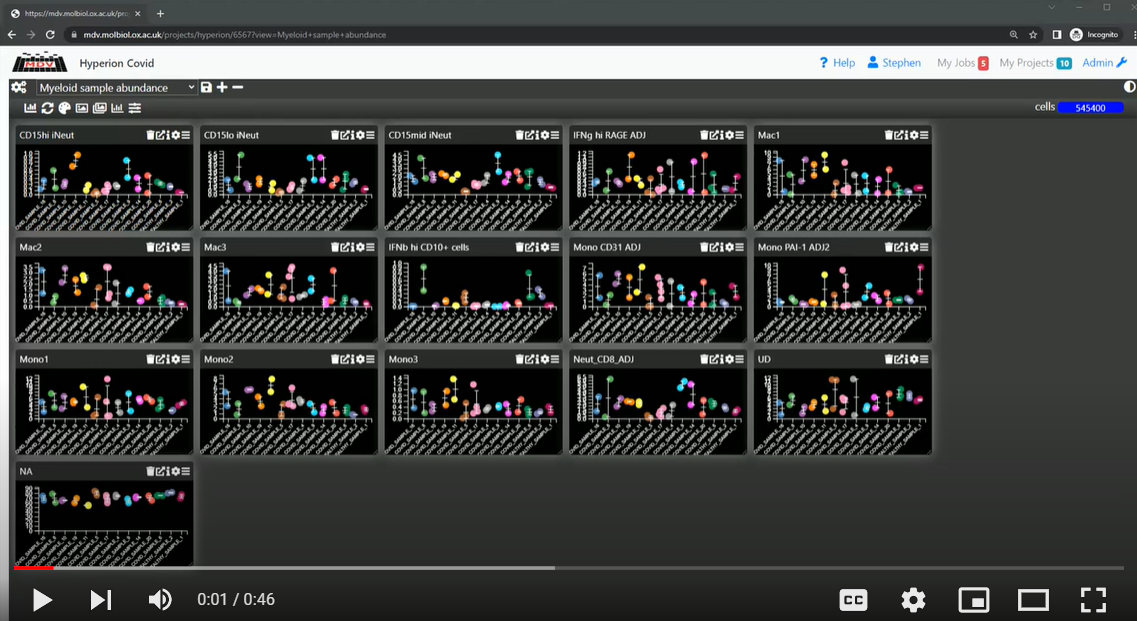
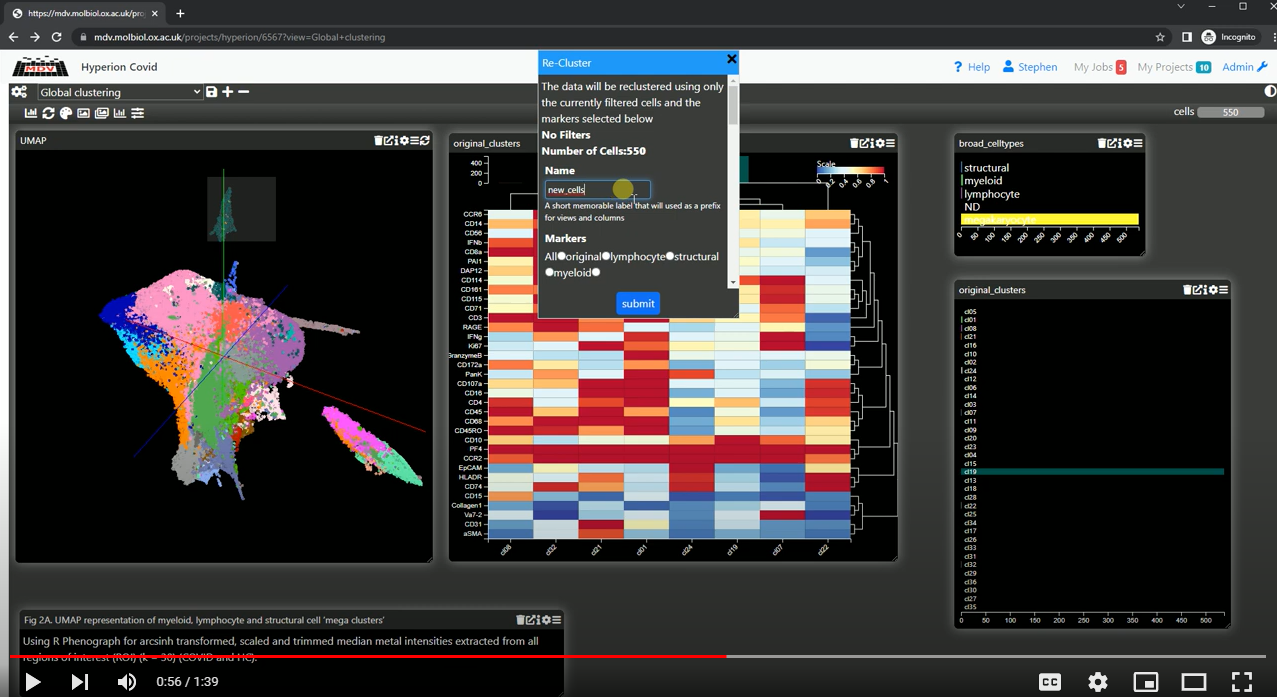
Spatial Clustering
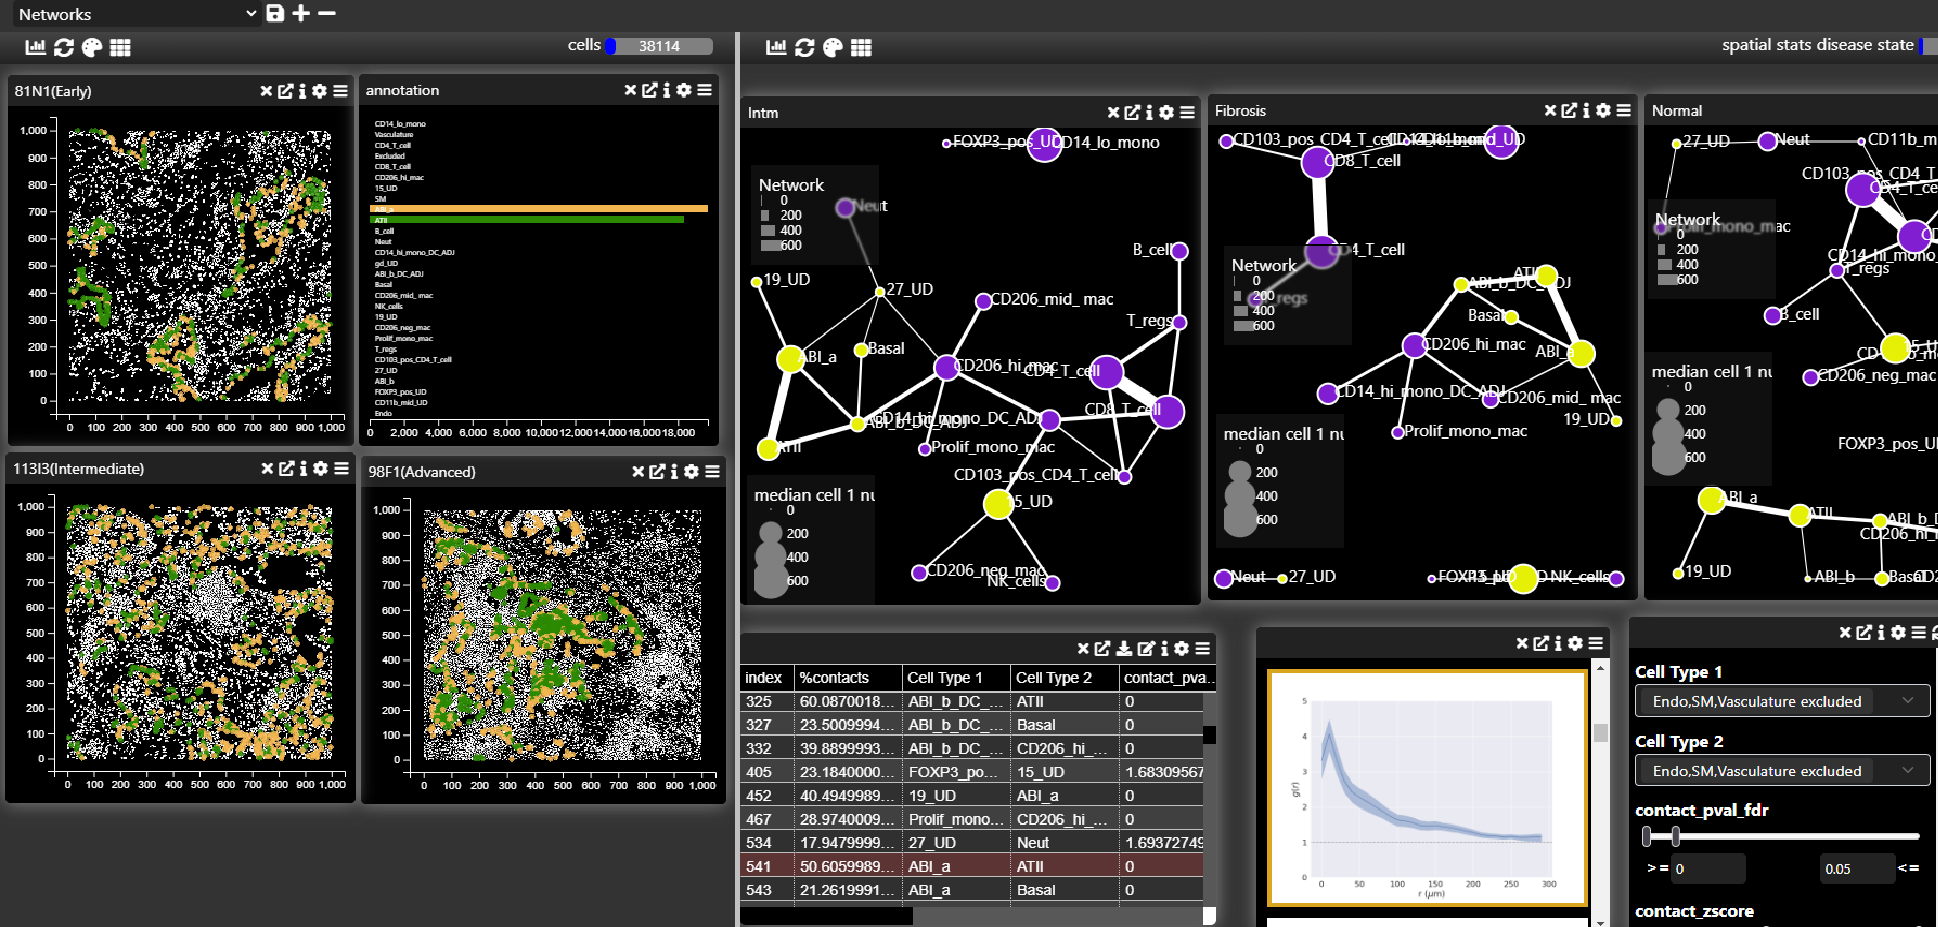
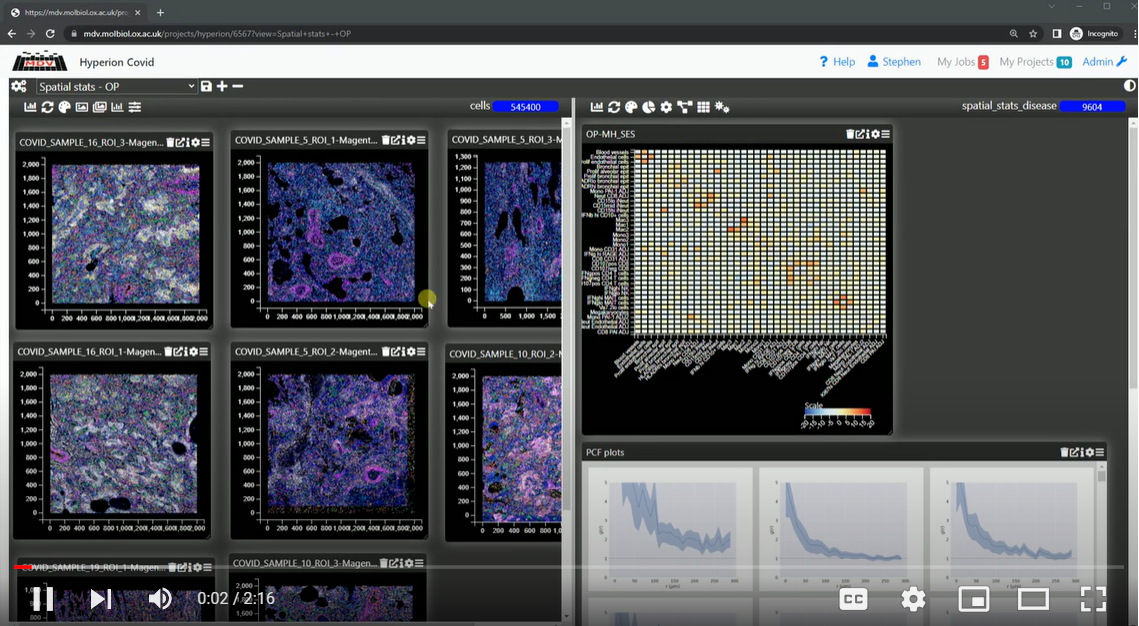
Spatial Network Analysis
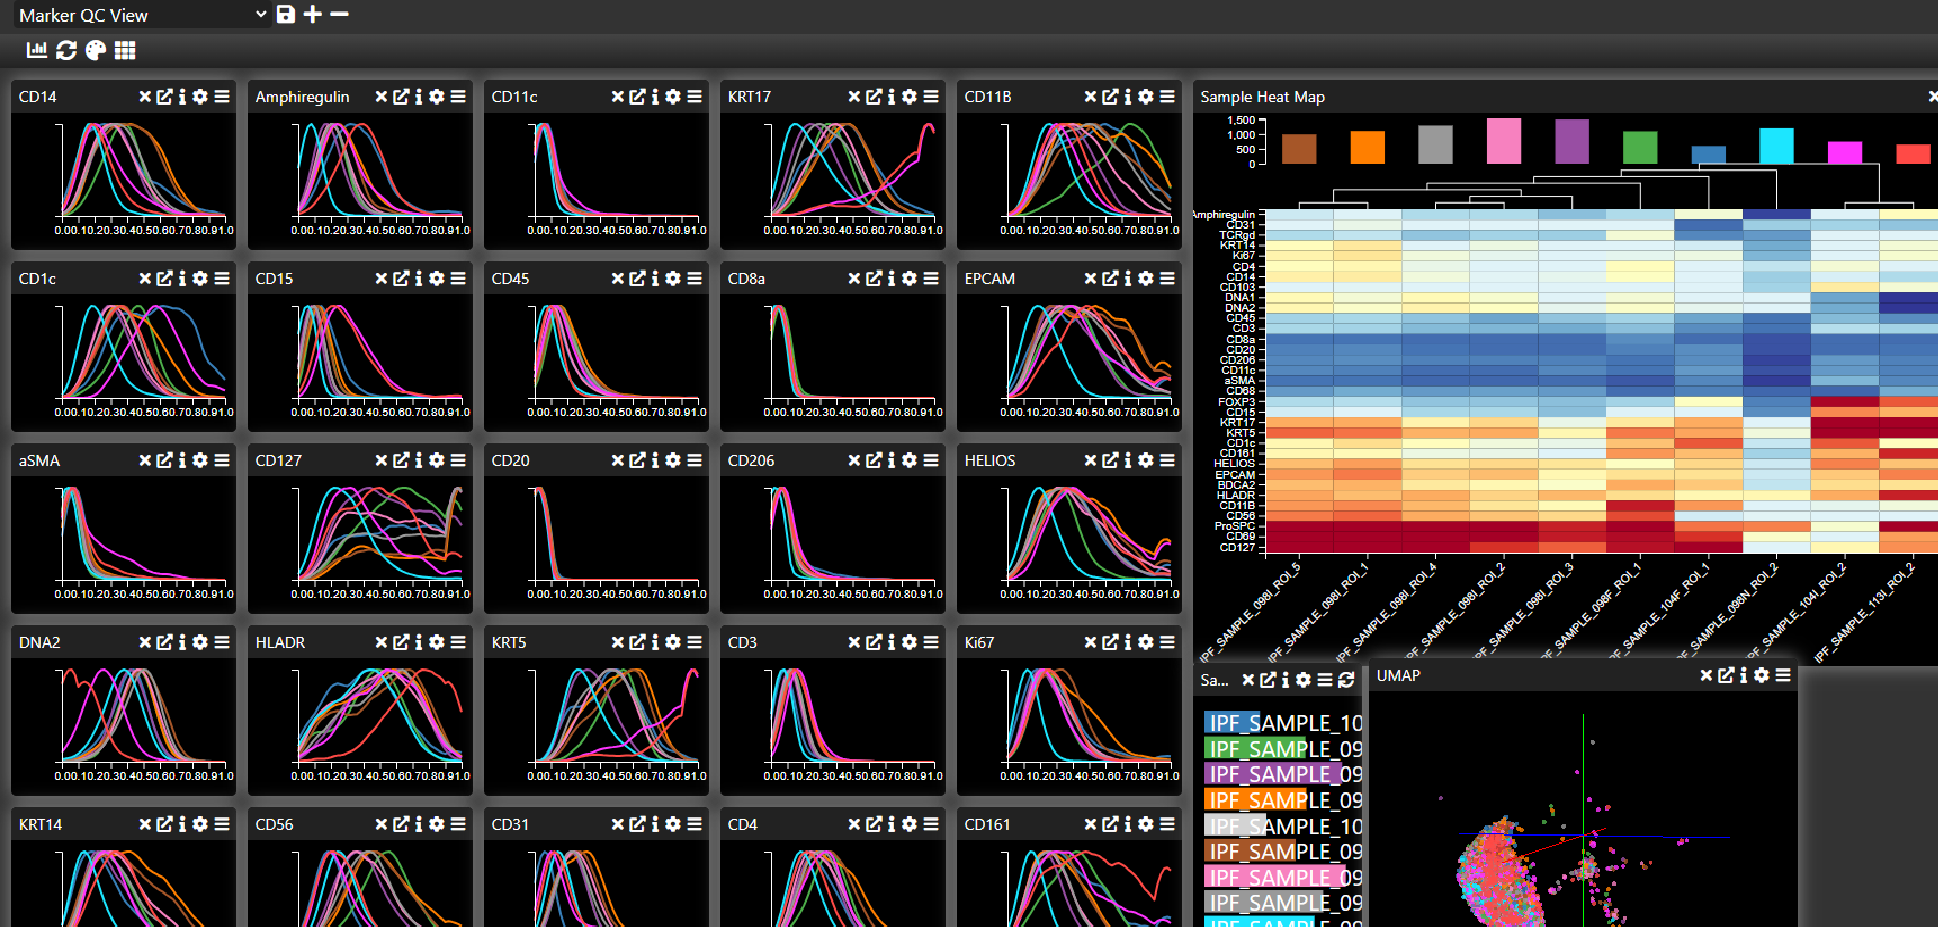
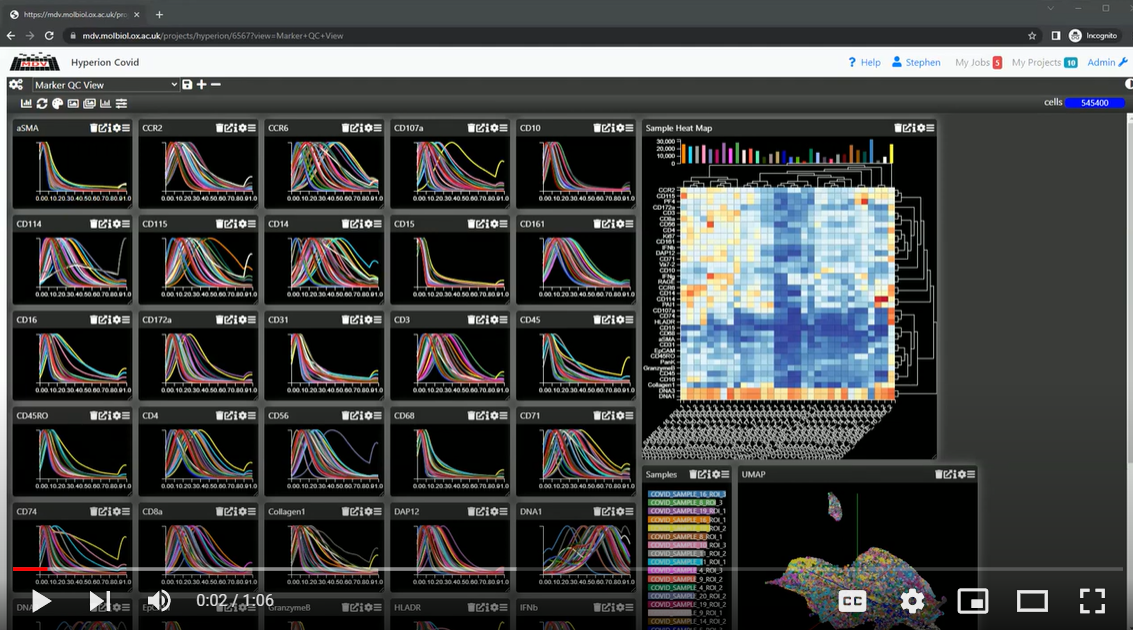
Spatial Marker QC
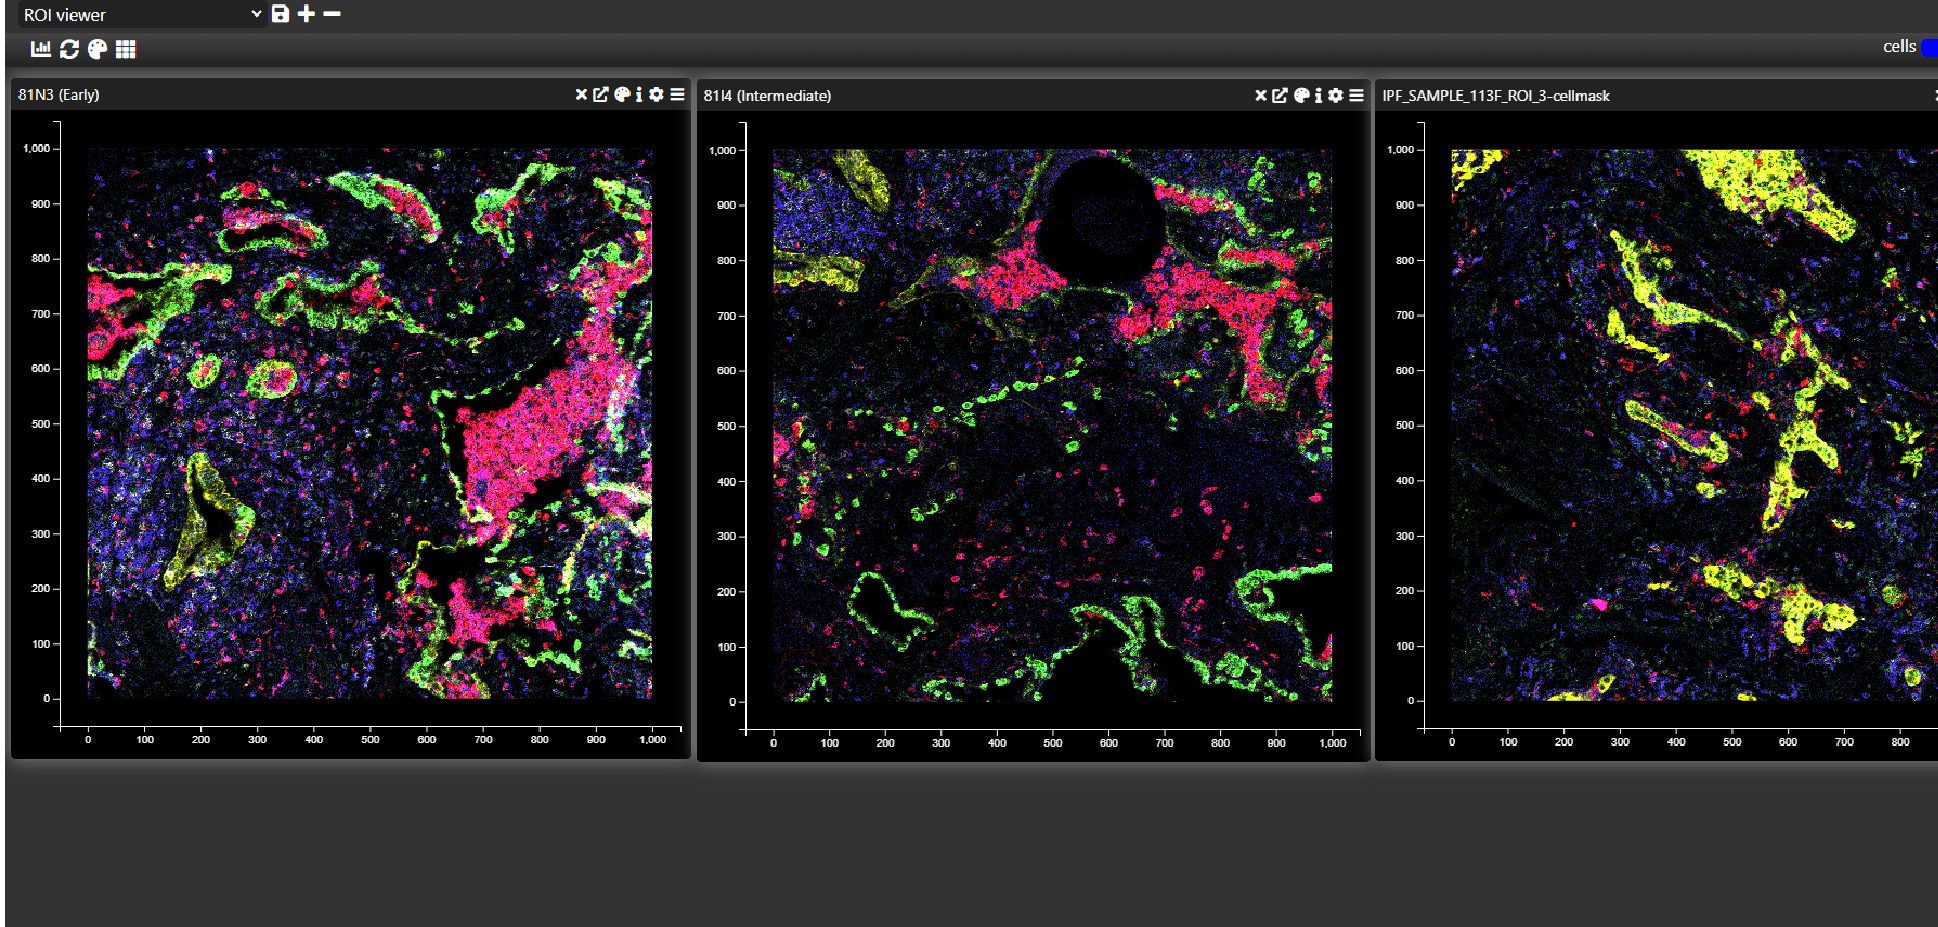
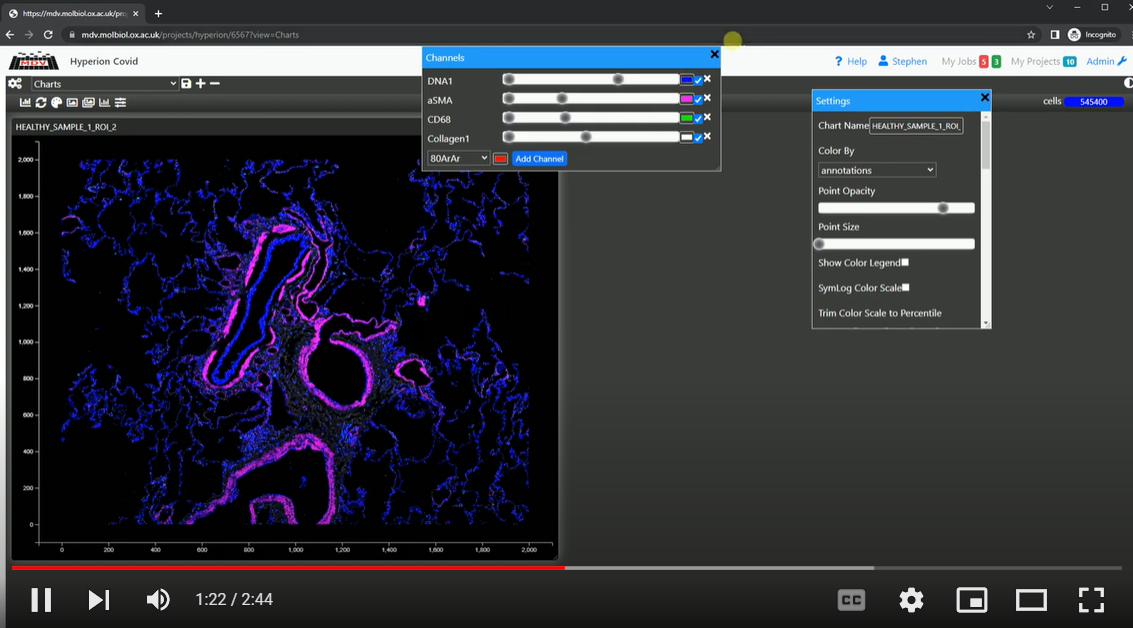
Spatial Image Analysis
Key Features
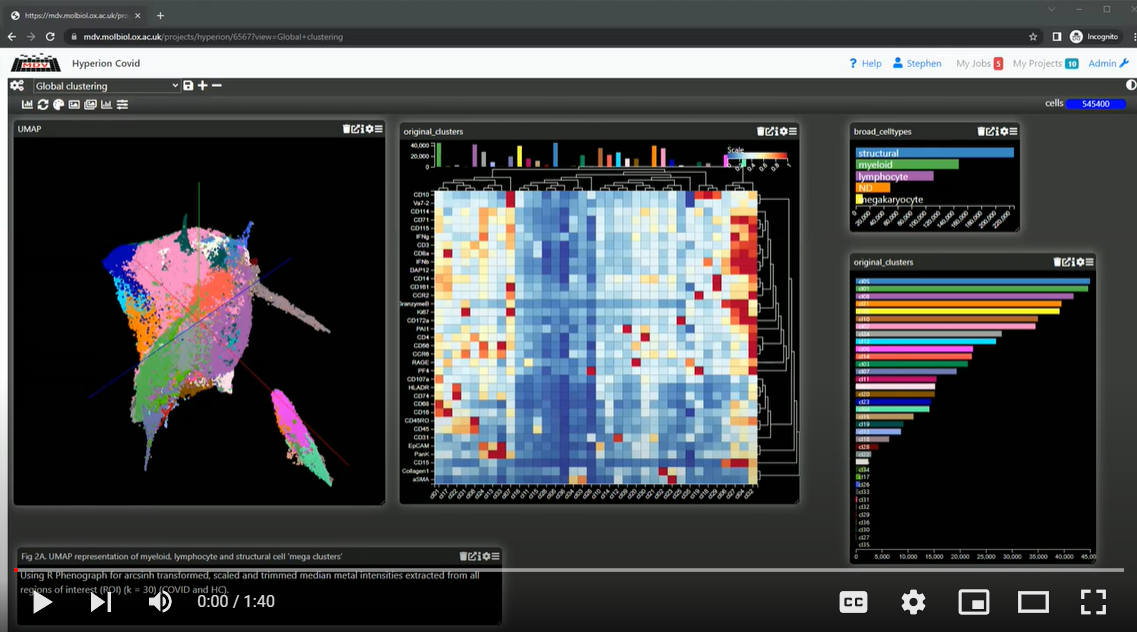
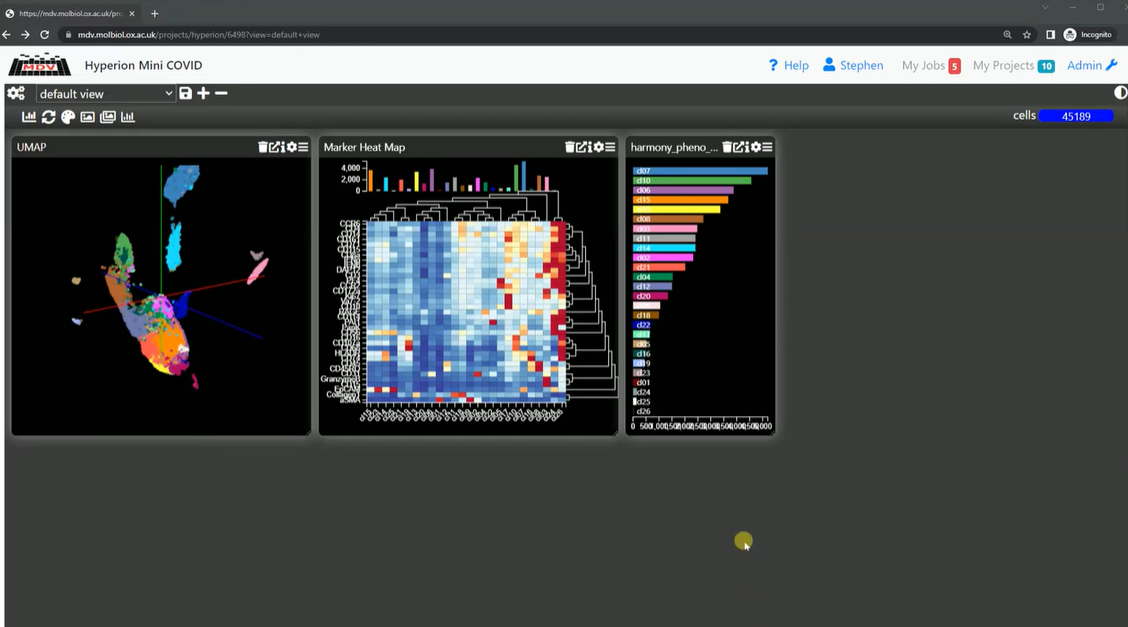
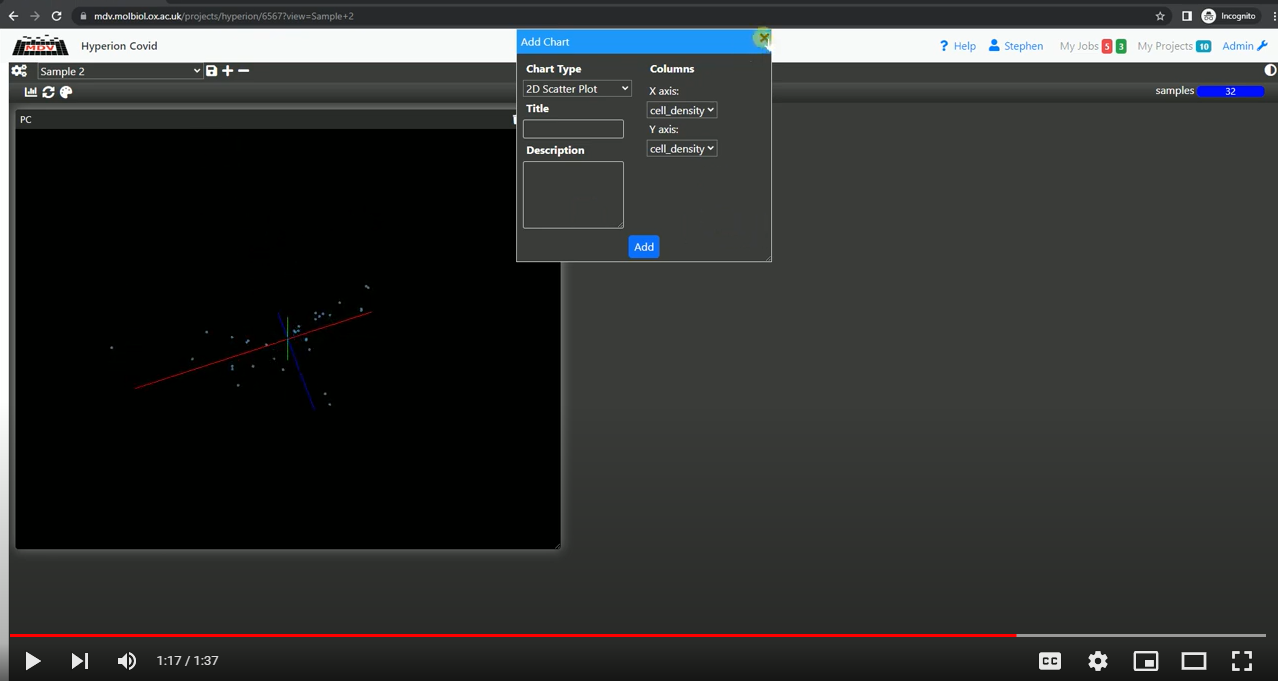
- Large assortment of interactive charts/widgets such as spread sheets, genome browser,image viewer and 3d scatter plot
- Multiple views of the same data
- Charts/Widgets can pop out into separate windows to take advantage of multiple screens
- Multiple data sources (tables) can be loaded and links defined between them
- Data can added and/or modified by the user
- Diverse range of data sources (API calls, static files) can be used by implementing custom data loaders
Contact Us
Reach out to us for inquiries, support, or to learn more about MDV.
Mailing List
mdv-alerts@maillist.ox.ac.ukEnquiries
mdv@ndm.ox.ac.ukVIDEOS
Watch a video demonstrating the basic functionality of MDV